3T and 7T Ex Vivo Diffusion Imaging in Tuberous Sclerosis Complex: Correlation with Histopathology
Abstract number :
2.180
Submission category :
5. Neuro Imaging / 5A. Structural Imaging
Year :
2018
Submission ID :
502302
Source :
www.aesnet.org
Presentation date :
12/2/2018 4:04:48 PM
Published date :
Nov 5, 2018, 18:00 PM
Authors :
Jurriaan M. Peters, Harvard Medical School, Boston Children's Hospital; Robbert Struyven, Boston Children's Hospital; Anna Prohl, Boston Children's Hospital; John Bushman, Rochester Institute of Technology; Hart G.W. Lidov, Boston Children's Hospital, Ha
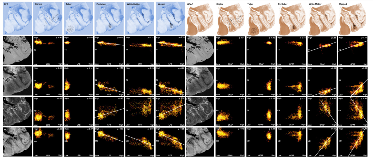
Rationale: To clarify the basis of abnormal diffusion in Tuberous Sclerosis Complex (TSC) in the proximity of epileptogenic tubers, we correlated ex vivo high-resolution diffusion imaging of white matter, perituber and tuber regions with histopathology. Methods: Three 'en-block' epilepsy surgical specimens from children with TSC were scanned in a 3T or 7T MRI with a structural image isotropic resolution of 137-300 micron, and diffusion image isotropic resolution of 270-1,000 micron. Next, we stained four specimens for myelin (luxol fast blue, LFB) and gliosis (glial fibrillary acidic protein, GFAP), and registered digitized slides (0.686 micron resolution) to high-resolution ex vivo MRI for histopathological comparison.Figure 1: Pre-operative imaging and orientation of resection specimens ex vivo.Resection regions are highlighted in the white rectangle in the preoperative images. Magnified frames of T1-weighted (T1w), fractional anisotropy (FA) and mean diffusivity (MD) are shown, and compared to the ex vivo images on the right. Note that the imaging plane is manipulated to match the ex vivo cutting plane and histopathology slides; e.g. case 1 is a pseudo-axial plane, and images may be inverted along any axis. Results: In white matter and perituber regions, LFB optical density (OD) correlated with fractional anisotropy (FA) and inversely with mean diffusivity (MD) and T2w intensity. In white matter but not perituber tissue, GFAP OD correlated with MD and T2w, and inversely with FA. In tubers and in the cortex, there was little variation in mean LFB and GFAP signal intensity, and no correlation with MRI metrics.Figure 2: Example: Quantitative comparison of histopathology and ex vivo MRI for case 2(LEFT ) Luxol fast blue (LFB) stain, after color deconvolution. (RIGHT ) Glial fibrillary acidic protein (GFAP) stain, after color deconvolution.In the left column, ex vivo structural images (T1w, T2w) and diffusion imaging (fractional anisotropy FA, mean diffusivity MD). On the top row, the regions of interest (ROIs) are placed in specific ultrastructural tissue types: Cortex, tuber, perituber, and white matter. In the last column, two tissue types (perituber and white matter) are merged, yielding a wider variability. The colored dots indicate intensity histograms, and the hot colors indicate more overlap between MRI metrics and histopathology optical density values. Spearman’s Rho correlations are listed, and regression lines are shown for higher values. Conclusions: These findings suggest diffusion imaging abnormalities in microscopic tissue types correspond to specific histopathological markers in TSC. Funding: J. Peters, B. Scherrer, S. Prabhu, M. Sahin, and S. Warfield are supported by NIH R01 NS079788 and U01 NS082320 grants. A. Prohl is supported by Harvard Catalyst | The Harvard Clinical and Translational Science Center (National Center for Research Resources and the National Center for Advancing Translational Sciences, NIH award UL1 TR001102). S. Prabhu is also supported by the Department of Defense W81XWH-11-1-0365. M. Sahin is additionally supported by NIH U54 HD090255 and U54 HD090255 grants and the Boston Children’s Hospital Translational Research Program. The Developmental Synaptopathies Consortium (U54 NS092090) is part of the NCATS Rare Diseases Clinical Research Network (RDCRN). RDCRN is an initiative of the Office of Rare Diseases Research (ORDR), NCATS, funded through collaboration between NCATS, NIMH, NINDS, and NICHD. We thank the Harvard Medical School Neurobiology Department and the Neurobiology Imaging Facility for consultation and instrument availability that supported this work. This facility is supported in part by the Neural Imaging Center as part of an NINDS P30 Core Center grant #NS072030.

.tmb-.png?Culture=en&sfvrsn=7b5daf51_0)