SPECTRAL RELIABILITY OF VHS ARCHIVED EEG DATA IN PATIENTS WITH EPILEPSY
Abstract number :
1.118
Submission category :
Year :
2002
Submission ID :
81
Source :
www.aesnet.org
Presentation date :
12/7/2002 12:00:00 AM
Published date :
Dec 1, 2002, 06:00 AM
Authors :
Christopher P. Baker, Robert E. Hogan. Neurology, Saint Louis University School of Medicine, Saint Louis, MO
RATIONALE: Archiving EEG data on VHS tapes potentially introduces data artifacts. We preformed a validation study to assess spectral differences between EEG data archived digitally and archived on VHS tapes.
METHODS: We retrospectively reviewed records in 5 patients whose EEG data was archived to both analog VHS (aEEG) and directly to digital media (dEEG). All EEG data was acquired using the Telefactor Corp. Beehive-7, single-computer, integrated Beehive/SzAC system. The data was recorded at 200 samples/second and 12 bits/channel.
Continuous 45-second segments were selected from each of the five patient EEG records. The aEEG data segments were re-digitized and exported to European Data Format (EDF) files using Grass-Telefactor TWin[tm] Recording & Analysis Software (v. 2.5). The dEEG data segments were opened and exported to EDF files using the same Grass-Telefactor software.
The EDF file pairs were imported into MATLAB (R12) and 5 five-second data epochs were selected from each imported 45-second segment. The first five-second epoch from each patient record was discarded due to artifact. Additionally, all epoch pairs (dEEG and aEEG) were shifted against each other and cropped appropriately to compensate for a lack of synchrony associated with the aEEG re-digitization process.
The power spectrum for each 5-second epoch was computed using the Fast Fourier Transform (FFT) in MATLAB. A Hanning window and a 512-point FFT were used in the transform. The raw power spectrum data for each epoch was divided up into standard frequency bands ([delta]: 0.75-4 Hz, [theta]: 4-8 Hz, [alpha]: 8-12.75, [beta]: 12.75-31 Hz) and the total power contained in each band was summed. Each band[scquote]s percentage of the total power (power within the total frequency range: 0.75-31 Hz) was also calculated. The difference in band percentage power between the aEEG and dEEG data was calculated. The mean and standard deviation of those differences over all epochs, patients, and channels, were also calculated.
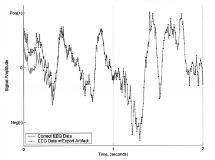
RESULTS: The data import/export process generated the majority of the notable artifacts. During the first 1-2 seconds of the EDF export process, the EEG was deflected, either positively or negatively, until it reached a reliable study-state. [figure1] There was also a lack of synchrony between the aEEG and dEEG data during the aEEG re-digitization process. In general, the dEEG data lagged 1-200 samples behind the aEEG data. Additionally, the re-digitization process introduced and sometimes deleted samples. The sample addition/deletion artifact was minimal and deemed notable, but insignificant.
On average, the mean absolute value of the difference between the dEEG and aEEG band percentage of total power was 0.051% for the [delta] band (STD = 0.854%), 0.027% for the [theta] band (STD = 0.620%), 0.052% for the [alpha] band (STD = 0.501%), and 0.026% for the [beta] band (STD = 0.781%).
CONCLUSIONS: While there were minor spectral differences between aEEG and dEEG data, the differences were insignificant. Thus, data archived on VHS tapes is acceptable for use in spectral EEG studies.[figure1] [figure2]
